

North West the Driving Force in UK’s Price Rise
According to Zoopla reports released last week the annual rate of the UK house price growth is up 4.3%, the highest since April 2017. Very high growth is coming from the North West, Yorkshire and Wales where strong demand and attractive affordability have all seen growth rates of over 5%. The rate of annual price inflation is highest in the North West and Wales as both hit rates of +5.4% – see map below. Despite the new lockdown, demand for homes has posted the usual seasonal rebound which has been stronger than last year. Demand for homes is up 13% on this time last year, with new sales agreed also up 8%.
Liverpool out of all of the cities has jumped to the top of the growth rankings with house prices rising by 6.3% over the last 12 months – this is the highest annual growth rate for 15 years! Manchester is close behind with a growth rate of +6.0%, back to levels of inflation last seen 2 years ago. On the contrary to the North West, affordability pressures are acting as a drag on price growth across southern England at the moment.
This latest news released last week may be a surprise to some but not to our team here at Flambard Williams. In recent years we have regularly been telling our clients about the strength the North West has when it comes to the potential growth and the momentum that it’s house prices will continue to gain. (Don’t believe us? See HERE for our previously released media).
North West Properties | Liverpool Properties | Manchester Properties
UK house price index summary – December 2020
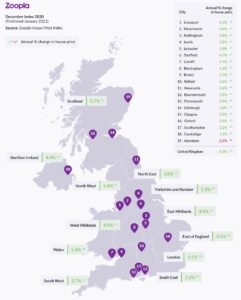
UK house price city summary – December 2020
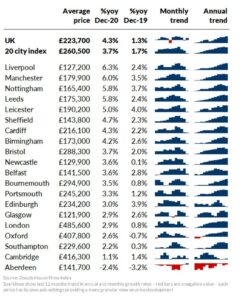
Source for summaries above – Zoopla
North West Properties | Liverpool Properties | Manchester Properties